Chart Art: Triangle Patterns On USD/CAD USD/CAD USD/CAD USD/CAD & Shiba Inu (SHIB/USD)
Both USD/CAD and SHIB/USD are consolidating inside triangle patterns on their longer-term charts.
Are we about to see breakouts soon?
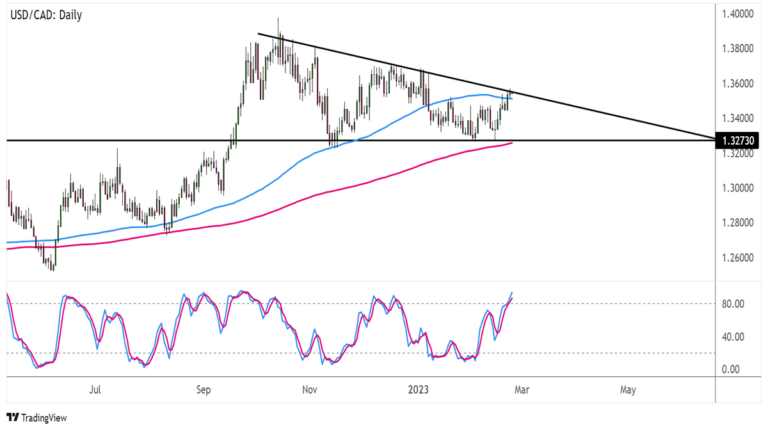
USD/CAD : Daily
This forex pair has formed lower highs and found support around the 1.3250 minor psychological mark, creating a descending triangle on its daily chart.
Price is currently testing the resistance and might be thinking of breaking out soon, but what are technical indicators saying?
If an upside breakout happens, USD/CAD could rally by the same height as the chart pattern, which spans roughly 700 pips.
Stochastic, on the other hand, is hinting that buyers could use a break soon. The oscillator is closing in on the overbought region and might turn lower to indicate that selling pressure is returning.
In that case, USD/CAD could retreat to the triangle support near the 200 SMA dynamic inflection point.
Just keep an eye out for either reversal or breakout candlesticks at the triangle top for more clues!
You only have to do a very few things right in your life so long as you don't do too many things wrong.
Warren Buffett