Equities Watchlist: FTSE (UK100) FTSE (UK100) FTSE (UK100) FTSE (UK100) Pulled Back to a Key Retracement Zone
In case you missed it, Asian and European session traders got spooked by liquidity concerns among the major U.S. banks and fears that it might spark contagion across the world.
Luckily, U.S. regulators stepped in and eased some of the investors’ fears.
It wasn’t until the U.S. session, however, when speculations of the Fed dialing down its tightening plans gained ground. Many now believe that the Fed will raise its rates by 25bps, lower than the 50bps rate hike that markets priced in after Powell’s testimonies last week.
U.S. equity indices like the S&P 500, NASDAQ, and the Dow ended the day higher despite some interesting daily candlestick wicks.
FTSE Index (UK100) FTSE Index (UK100) FTSE Index (UK100) FTSE Index (UK100) Daily
U.K.’s equities missed the bus on the risk-taking though! Of course, it didn’t help that HSBC (Europe’s largest bank) acquired the British subsidiary of SVB for 1 GBP. This rescued a key lender for technology startups in Britain but also acquired its headaches.
U.K.’s equities index FTSE (UK100), which already dropped sharply on Thursday and Friday, fell below the 7,600 mark and reached its two-month lows.Will U.K. equities catch up to the optimism in the U.S.?
FTSE (UK100) is sitting on a relatively attractive level for those who are looking at the stock index’s chart.
It’s not only hanging out at a previous resistance zone and the 38.2% Fibonacci retracement of a major upswing, but it’s also showing a bullish divergence on the daily time frame.
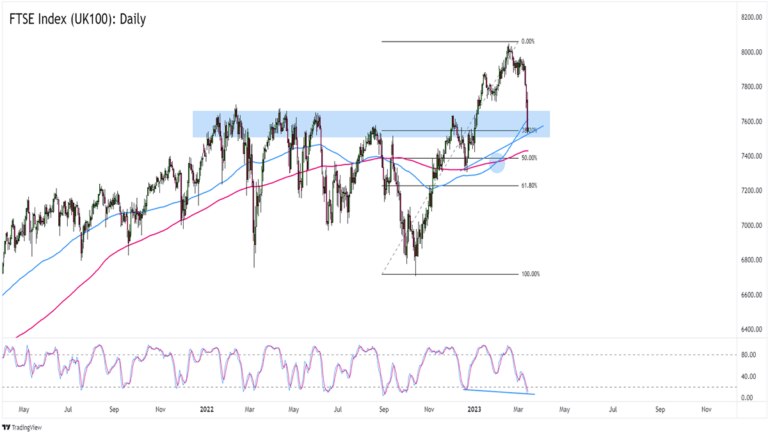
Risk-takers who believe that FTSE’s uptrend remains intact, or that Chancellor of the Exchequer Jeremy Hunt’s Budget report later this week will boost risk appetite can start scaling in at current levels while aiming for the index’s previous highs near 8,000.
More conservative traders can wait for at least a couple of green candlesticks or bullish momentum before jumping on FTSE’s months-long uptrend.
Think the stock index is headed lower? You can also wait and see if the 200 SMA holds as support. If FTSE drops below the 7,400 zone, then you can target previous areas of interest like 7,200 or even the big 7,000 psychological level.
Charts are wonderful in finding specific spots for asymmetric risk/reward trades. That’s it.
Peter L. Brandt